Metrics
The ** metrics** provides a quick health check for the service.
It summarizes key Site Reliability Engineering (SRE) metrics that help engineers monitor the performance and reliability of the system.
Service Level Objective (SLO)
The Service Level Objective (SLO) defines the reliability target for the service.
- Availability: 99.95%
- Target: 99.9%
If the current availability meets the defined target, the dashboard indicates that the service is Meeting SLO.
Golden Signals (SRE)
The dashboard tracks the four golden signals of SRE, which are essential metrics used to monitor system health.
Latency
Latency measures how long it takes for a system to respond to a request.
- P95 Latency: 120ms
- P99 Latency: 253ms
Lower latency ensures faster responses and a better user experience.
Traffic
Traffic indicates the number of incoming requests handled by the system.
- Requests Per Second: 4.4 RPS
Monitoring traffic helps identify system load and user demand.
Error Rate
Error rate represents the percentage of requests that fail.
- Error Rate: 0.50%
- Errors per second: 0.020
A higher error rate may indicate system instability or service issues.
Saturation
Saturation measures how heavily system resources are being used.
- Memory Usage: 65.3%
High saturation levels may impact performance if system resources become fully utilized.
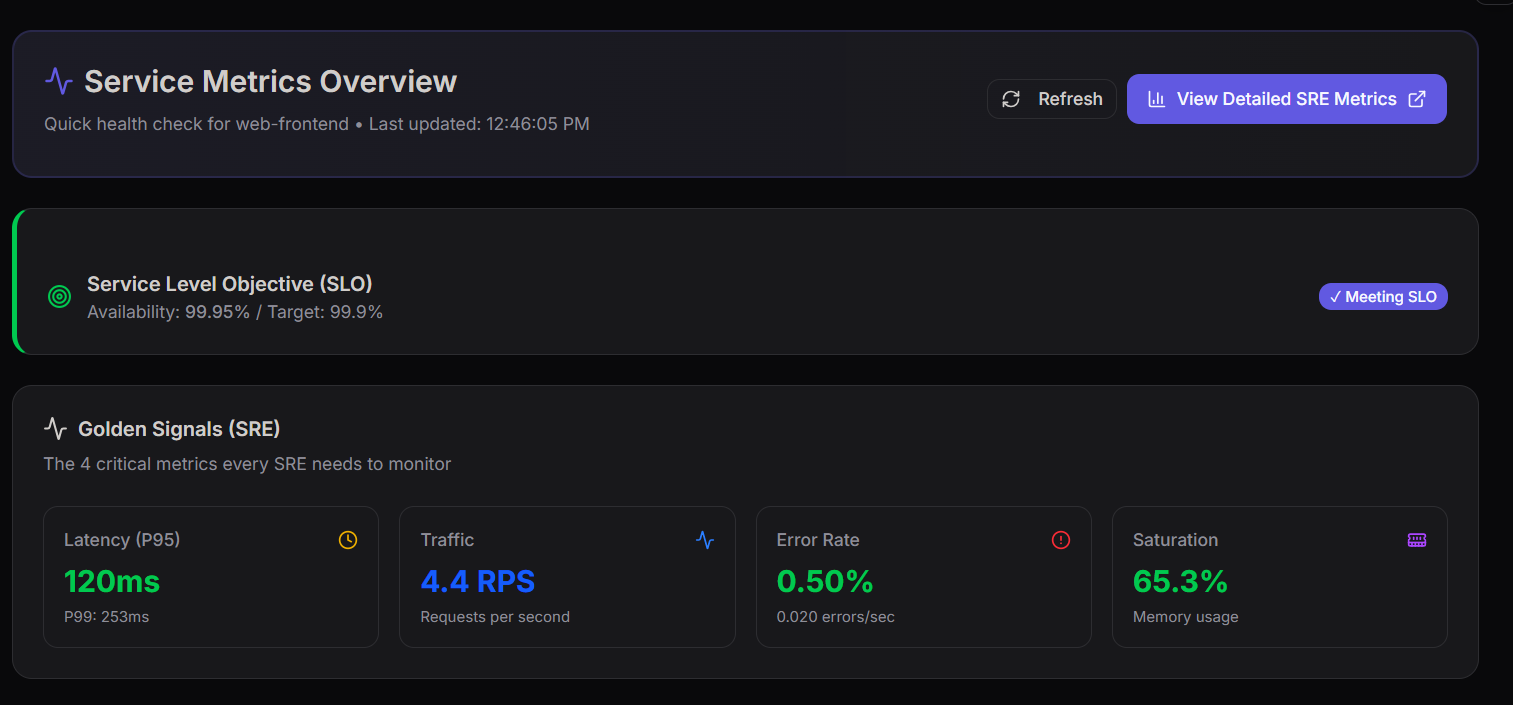
The image above shows the Service Metrics Overview Dashboard, which provides a quick visual summary of service health and performance.
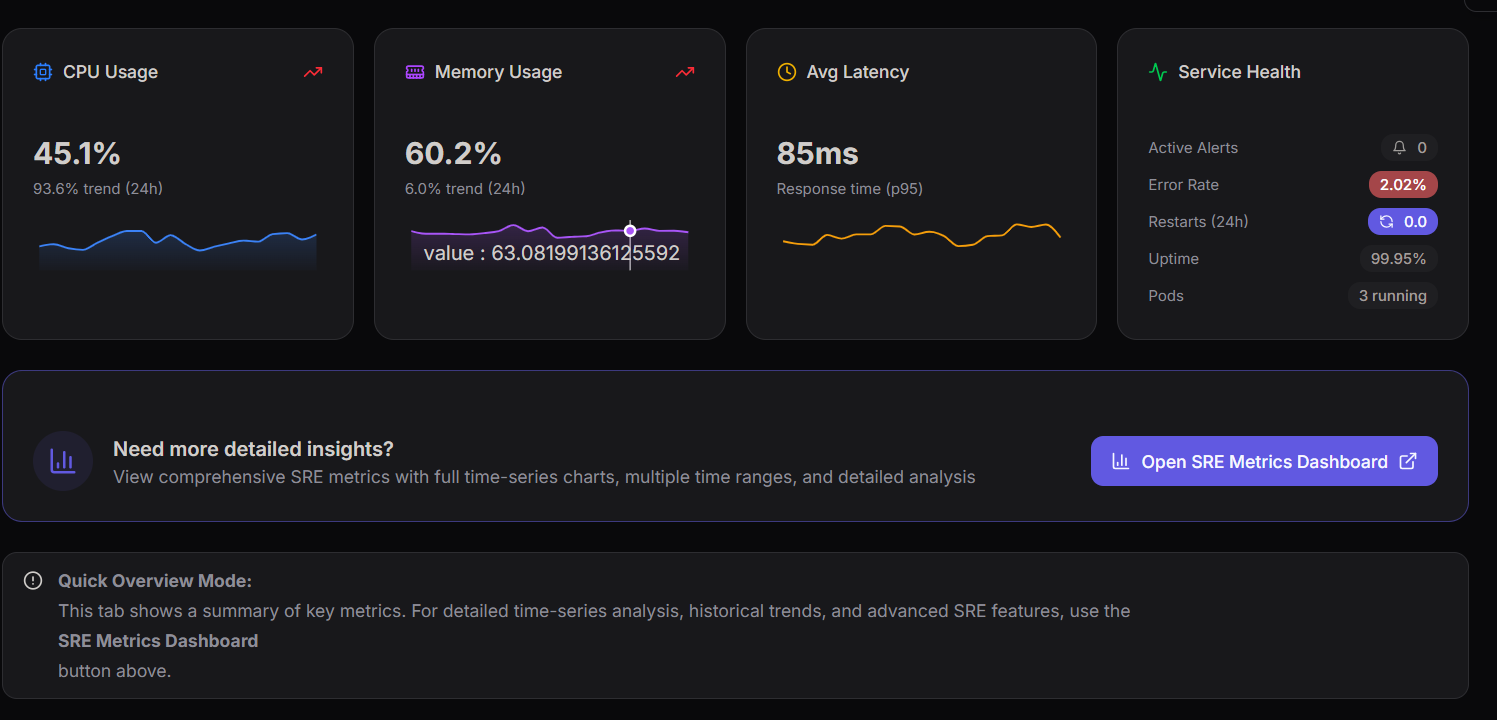
Infrastructure Metrics
The dashboard also includes infrastructure performance indicators.
CPU Usage
This metric shows how much processing capacity the service is consuming.
- CPU Usage: 45.1%
- 24-hour trend: Increasing
Memory Usage
Memory usage tracks how much RAM is being used by the application.
- Memory Usage: 60.2%
- 24-hour trend: 6.0%
Average Latency
Average latency provides a general overview of system response time.
- Response Time (P95): 85ms
Service Health
The Service Health panel provides a quick operational summary of the system.
Key indicators include:
- Active Alerts
- Error Rate
- Restarts (24h)
- Uptime
- Running Pods
Example values:
- Error Rate: 2.02%
- Restarts (24h): 0
- Uptime: 99.95%
- Pods Running: 3
These metrics help engineers quickly evaluate the operational health of the service.
DNS Query Analytics Dashboard
The DNS Query Analytics Dashboard provides a comprehensive view of DNS traffic patterns, query distributions, and response behaviors.
It enables teams to monitor DNS performance, analyze traffic sources, and identify potential issues in query resolution.
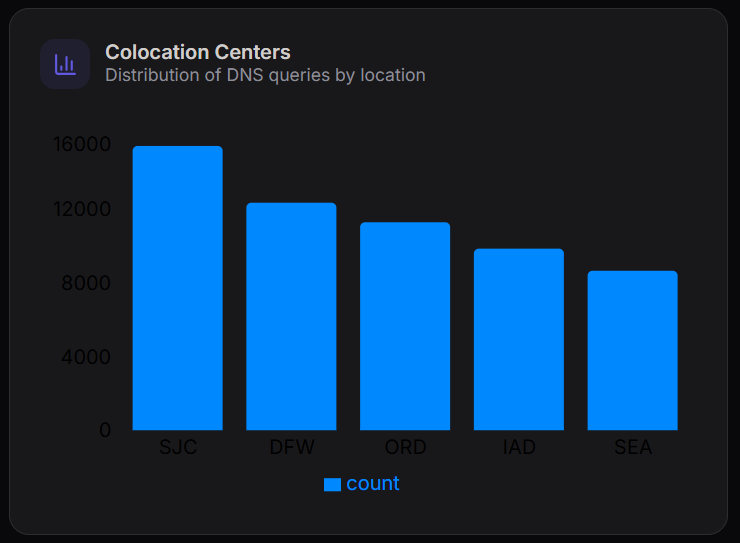
Colocation Centers
The Colocation Centers chart shows the distribution of DNS queries across different geographic locations.
Key Observations
- SJC (San Jose) handles the highest number of queries (~16,000)
- DFW (Dallas) and ORD (Chicago) follow with moderate traffic
- IAD (Virginia) and SEA (Seattle) show comparatively lower query volumes
This helps in understanding traffic distribution across regions and identifying high-load data centers.
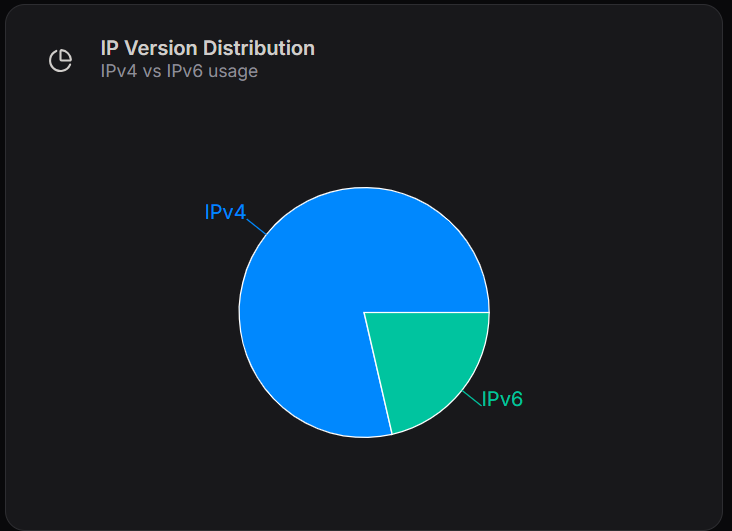
IP Version Distribution
The IP Version Distribution chart compares IPv4 and IPv6 usage.
Breakdown
- IPv4: Majority of DNS traffic
- IPv6: Smaller but growing portion of traffic
This indicates that while IPv4 remains dominant, IPv6 adoption is increasing.
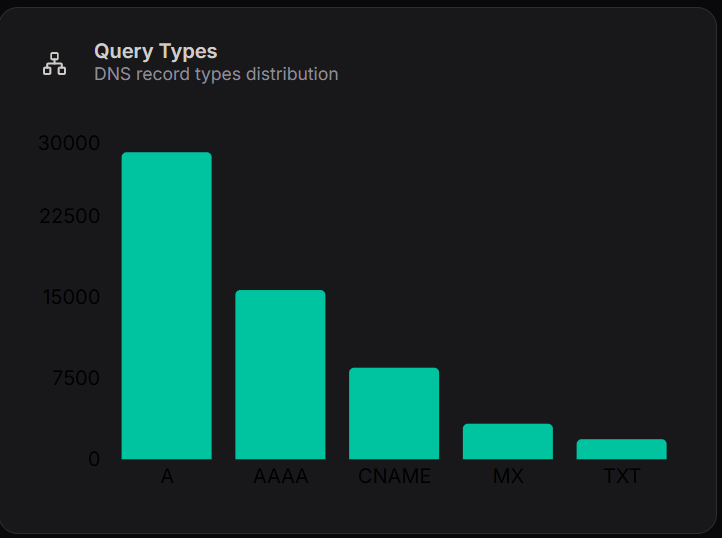
Query Types
The Query Types chart shows the distribution of DNS record types.
Key Insights
- A Records: Highest usage (~30,000)
- AAAA Records: Significant usage (~15,000)
- CNAME Records: Moderate (~8,000)
- MX Records: Lower (~3,000)
- TXT Records: Minimal usage
Interpretation
- A and AAAA records dominate due to IP resolution requirements
- MX and TXT records are used for email routing and verification purposes
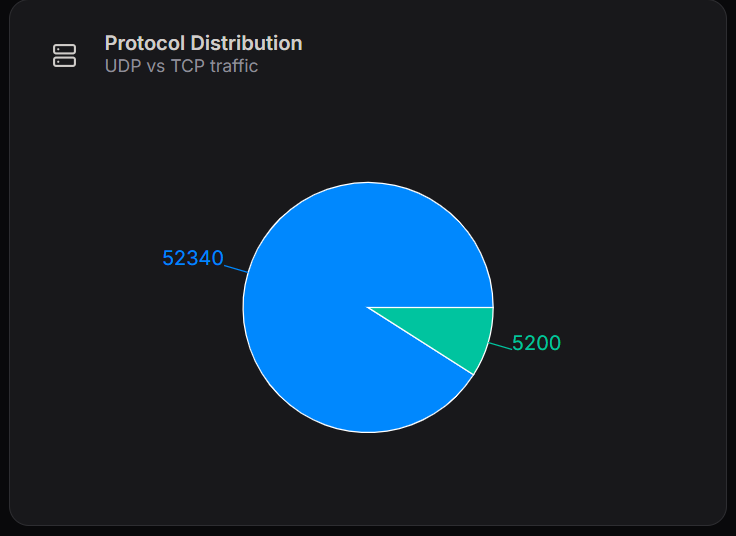
Protocol Distribution
The Protocol Distribution chart compares DNS traffic over UDP and TCP.
Breakdown
- UDP: ~52,340 requests
- TCP: ~5,200 requests
Interpretation
- UDP is the primary protocol due to its speed and low overhead
- TCP is used for:
- Large responses
- Zone transfers
- Reliability-critical operations
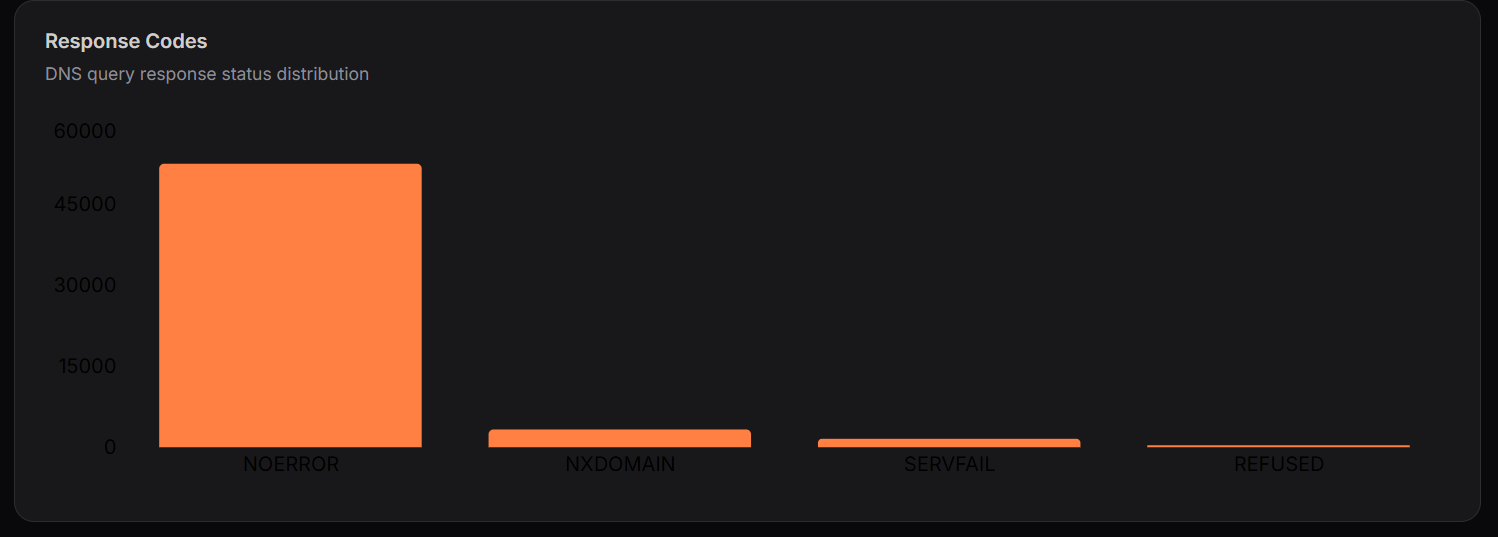
Response Codes
The Response Codes chart shows DNS query response statuses.
Key Metrics
- NOERROR: Majority (~50,000+)
- NXDOMAIN: Moderate number of failed lookups
- SERVFAIL: Low system/server failures
- REFUSED: Minimal access denials
Interpretation
- High NOERROR indicates healthy DNS resolution
- NXDOMAIN suggests queries for non-existent domains
- Low SERVFAIL reflects stable infrastructure
The DNS dashboard provides insights into:
- Geographic traffic distribution
- IP protocol adoption
- DNS query behavior
- Network protocol usage
- System reliability and response health
These metrics help ensure efficient DNS performance, reliability, and scalability.