Apps Dashboard
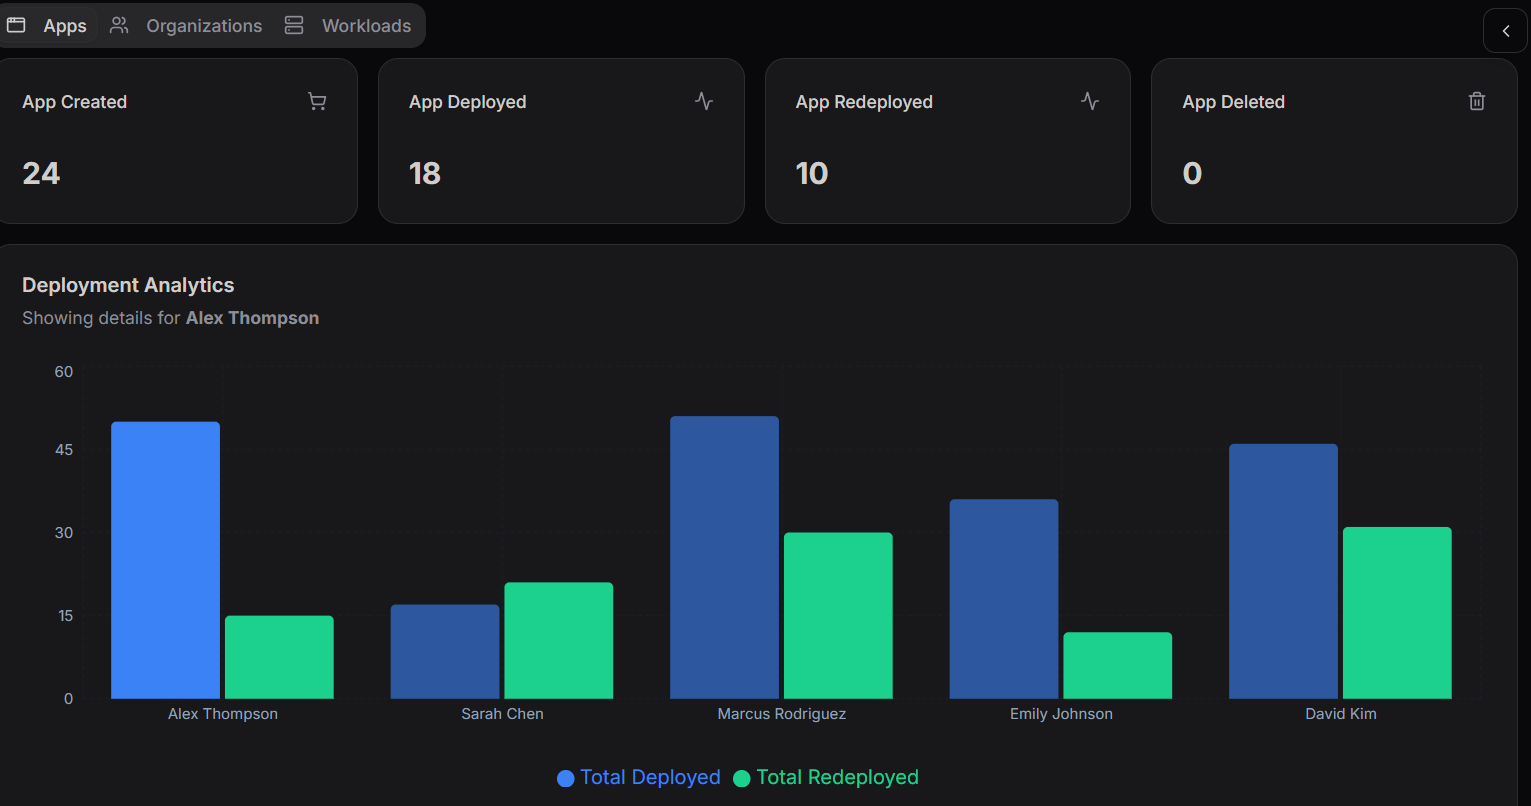
The Apps Dashboard provides a centralized view of application lifecycle metrics and deployment analytics.
It helps teams track application activity, monitor deployments, and analyze user-level deployment behavior.
Tab Navigation
The dashboard contains three top-level tabs that allow users to switch between different operational views.
Apps
The Apps tab is the currently active view.
It displays:
- Application lifecycle metrics
- Deployment analytics per user
- Activity trends for created, deployed, and redeployed applications
This view helps engineering teams understand how applications are progressing through the deployment lifecycle.
Organizations
The Organizations tab is designed to provide organization-level insights.
It is intended for:
- Viewing applications grouped by organization
- Monitoring team-level activity
- Managing organizational structures within the platform
Workloads
The Workloads tab focuses on infrastructure workload monitoring.
This view is intended for:
- Tracking system workloads
- Monitoring resource allocation
- Observing infrastructure usage patterns
Summary Metric Cards
At the top of the dashboard, four summary cards provide a quick snapshot of application activity.
App Created — 24
This represents the total number of applications created within the system.
It serves as the entry point of the application lifecycle funnel, capturing all newly initiated applications.
App Deployed — 18
This metric shows the number of applications that have been successfully deployed at least once.
The difference between 24 created and 18 deployed suggests that 6 applications are either pending deployment or were abandoned after creation.
App Redeployed — 10
This indicates the number of applications that have undergone at least one redeployment after their initial deployment.
Redeployments typically occur when:
- New updates are released
- Hotfixes are applied
- Configuration changes are made
Tracking redeployments helps teams understand iteration cycles and release frequency.
App Deleted — 0
No applications have been deleted during the current monitoring period.
This may indicate:
- High application retention
- No cleanup operations performed yet
Deployment Analytics Chart
The Deployment Analytics Chart provides a visual comparison of deployment activity across multiple users.
Subtitle:
Showing details for Alex Thompson
The chart displays two metrics:
- Total Deployed (Blue) – First-time deployments
- Total Redeployed (Green) – Subsequent deployments after the initial release
Alex Thompson
- Deployed: ~48
- Redeployed: ~15
Alex has a high number of deployments with a moderate redeployment rate, indicating active development with relatively stable releases.
Sarah Chen
- Deployed: ~16
- Redeployed: ~20
Sarah has more redeployments than deployments, which may indicate:
- Frequent hotfixes
- Iterative updates
- Rollbacks or quick release adjustments
Marcus Rodriguez
- Deployed: ~50
- Redeployed: ~30
Marcus has the highest deployment volume, combined with a significant number of redeployments.
This suggests fast-moving development cycles with frequent updates.
Emily Johnson
- Deployed: ~34
- Redeployed: ~10
Emily demonstrates a balanced deployment profile, with steady deployments and relatively low redeployments.
This often indicates stable release management practices.
David Kim
- Deployed: ~46
- Redeployed: ~30
David shows high activity across both metrics, similar to Marcus.
This likely indicates responsibility for multiple actively maintained applications.
Legend
The chart uses two color indicators to represent deployment activity.
🔵 Total Deployed
Represents first-time deployments of an application to an environment.
🟢 Total Redeployed
Represents subsequent deployments of an already deployed application, typically triggered by updates, patches, or configuration changes.